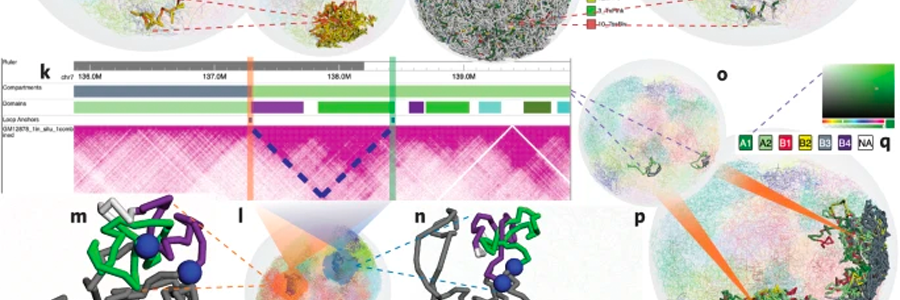
Three-dimensional (3D) genomic structures are vital for gene regulation and cell function1. High-throughput technologies based on chromosome conformation capture have been used to study genome-wide physical chromosome interactions2. These interactions can be visualized as 2D heatmaps3 or as interaction networks decorated with genomic features4. In addition, computational approaches using interaction data based on models, such as constrained physical models, polymer models and population-based analysis, have been developed to predict the physical 3D structures of chromosomes5. Large consortia, such as ENCODE6, Roadmap7, and 4D Nucleome8, have generated tens of thousands of genome-wide datasets of transcription factor binding sites and epigenetic marks across numerous cell types and tissues. Biologists wish to visually explore the connections between these genome-wide profiles and 3D genome structures, which will facilitate the generation and testing of diverse hypotheses. This presents a challenge to conventional genome browsers9, where most genomic data is visualized in linear genomic coordinates. The WashU Epigenome Browser was invented in 2011 as an interactive tool for exploring genomic data in a web browser9,10. We have now expanded the browser functions to allow investigators to visually explore 1D, 2D and 3D genomic data on a single webpage. The key innovation is to thread the linear genomic coordinates onto a multi-resolution 3D model of the chromosome.


